Brooklyn / Q3 points
37
Against Philadelphia’s 23 in the period.

LeBron James’ first game in Philadelphia ended in a 114–108 defeat. He was a positive in his minutes. Brooklyn’s third quarter was the difference.


For 24 minutes, Philadelphia had the edge. The 76ers led 58–56 at halftime. Then Brooklyn scored 37 points in the third quarter, stacked two unanswered runs of at least eight points, and carried a 12-point lead into the fourth.
James finished with 10 points, five assists and a +10 plus-minus in 18 minutes. Those were real contributions. They just weren’t the score that mattered at the buzzer.
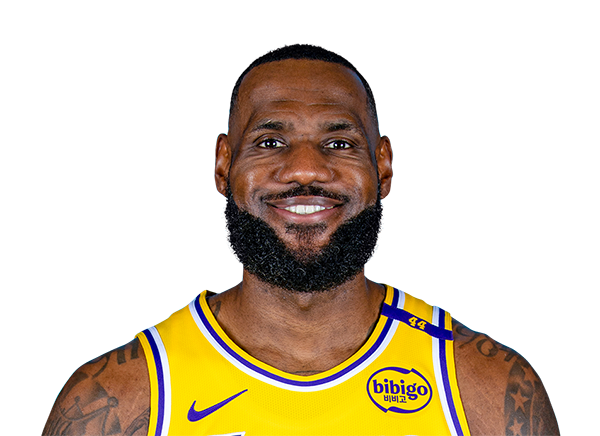
James took just one field-goal attempt and made it. Most of his scoring came at the line: 8-for-8 on free throws. He also led Philadelphia with five assists, sharing that game-high for the 76ers with Caleb Love.
A single-game plus-minus reports the score change while a player was on court. It doesn’t, by itself, tell us why those minutes went better.
In James’ 18 minutes, the 76ers were 10 points better. Since Philadelphia lost by six overall, its net margin during the other 30 minutes was minus 16.
These are on/off score margins, not points scored by James or a causal estimate of his impact.
Follow the four quarter-end score margins. Brooklyn erased Philadelphia’s halftime lead in an eight-point burst, then delivered an 11–0 run before the period ended.
Neither team emerged with an advantage from the first 12 minutes. The scoreboard stood at 33–33.
Philadelphia won the second period 25–23 to take a 58–56 lead into the break. The debut was on course for a different ending.
Brooklyn opened the quarter with an 8–0 run from 11:27 to 9:37, then put together 11 straight points from 3:39 to 0:37.2. Its 37–23 quarter turned a two-point deficit into a 12-point lead.
The 76ers won the final period 27–21. They cut the margin in half, but Brooklyn had already built enough of a cushion.
Quarter numbers are BKN minus PHI, not the running game margin. Source: VizNBA game box score.
Brooklyn made three more 3-pointers and took 18 more field-goal attempts. Philadelphia was more accurate from the foul line, but other parts of the box score leaned toward the Nets.
Philadelphia gave it away six more times. Brooklyn also recorded 14 steals to the 76ers’ eight, and outscored them 23–14 on fast breaks.
That margin matters when the opponent is leaving points on the table at the stripe.

LeBron’s debut drew the attention. The leading scorers belonged to two other forwards.
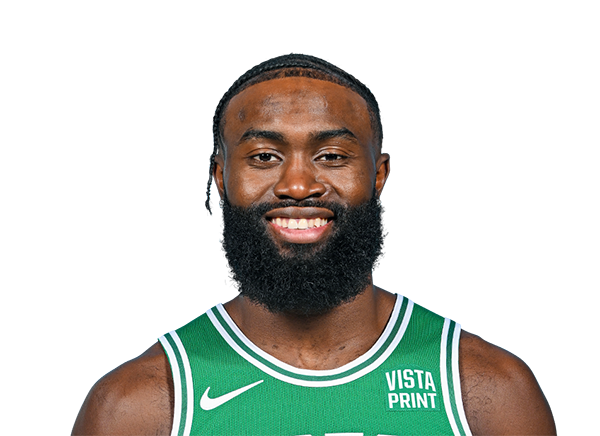
5-of-9 shooting, 7-of-7 from the line.

Six rebounds, two steals and 6-of-7 at the line.
Tyrese Maxey added 14 for Philadelphia. Joel Embiid scored six and committed eight turnovers. For Brooklyn, Egor Demin supplied 13 points and five assists.
Source: VizNBA / ESPN player box scores. Player portraits: ESPN.
Philadelphia won the second and fourth quarters, and James’ first minutes in a 76ers uniform produced a positive score margin. The Nets won the one stretch that mattered most: 37–23 in the third.
One game cannot settle what James will mean to this lineup. It can tell us exactly what happened on his opening night as a Sixer: the individual number was positive; the final one wasn’t.
All game scores, player lines, team statistics, runs and team records in this story come from the game context provided for Oct. 8, 2026, drawn from ESPN public NBA box-score data and read on Oct. 9 at 09:36 UTC. All derived values are simple arithmetic using that data. Quarter-end lead values are reconstructed from the four quarter scores; no full possession-level margin series was supplied. The on/off margin is the game’s −6 net score minus James’ +10 plus-minus. One game is a sample of one; no season trend or causal lineup effect is claimed.